Viewer: Interactive Geospatial Data Web App, 2018
Web-based tool enabling scientists to edit and share satellite imagery visualizations without code, making complex geospatial data accessible through the browser
Role: UX Designer & Frontend Engineer
Company: Descartes Labs
Timeline: 2018-2021
Team: 2-3 frontend engineers, applied scientists, product
Overview #
Descartes Labs scientists used APIs to process satellite imagery through machine learning - detecting agricultural changes, predicting crop yields, monitoring environmental shifts. But sharing results required programmatic API access, creating a barrier for customers and sales demonstrations.
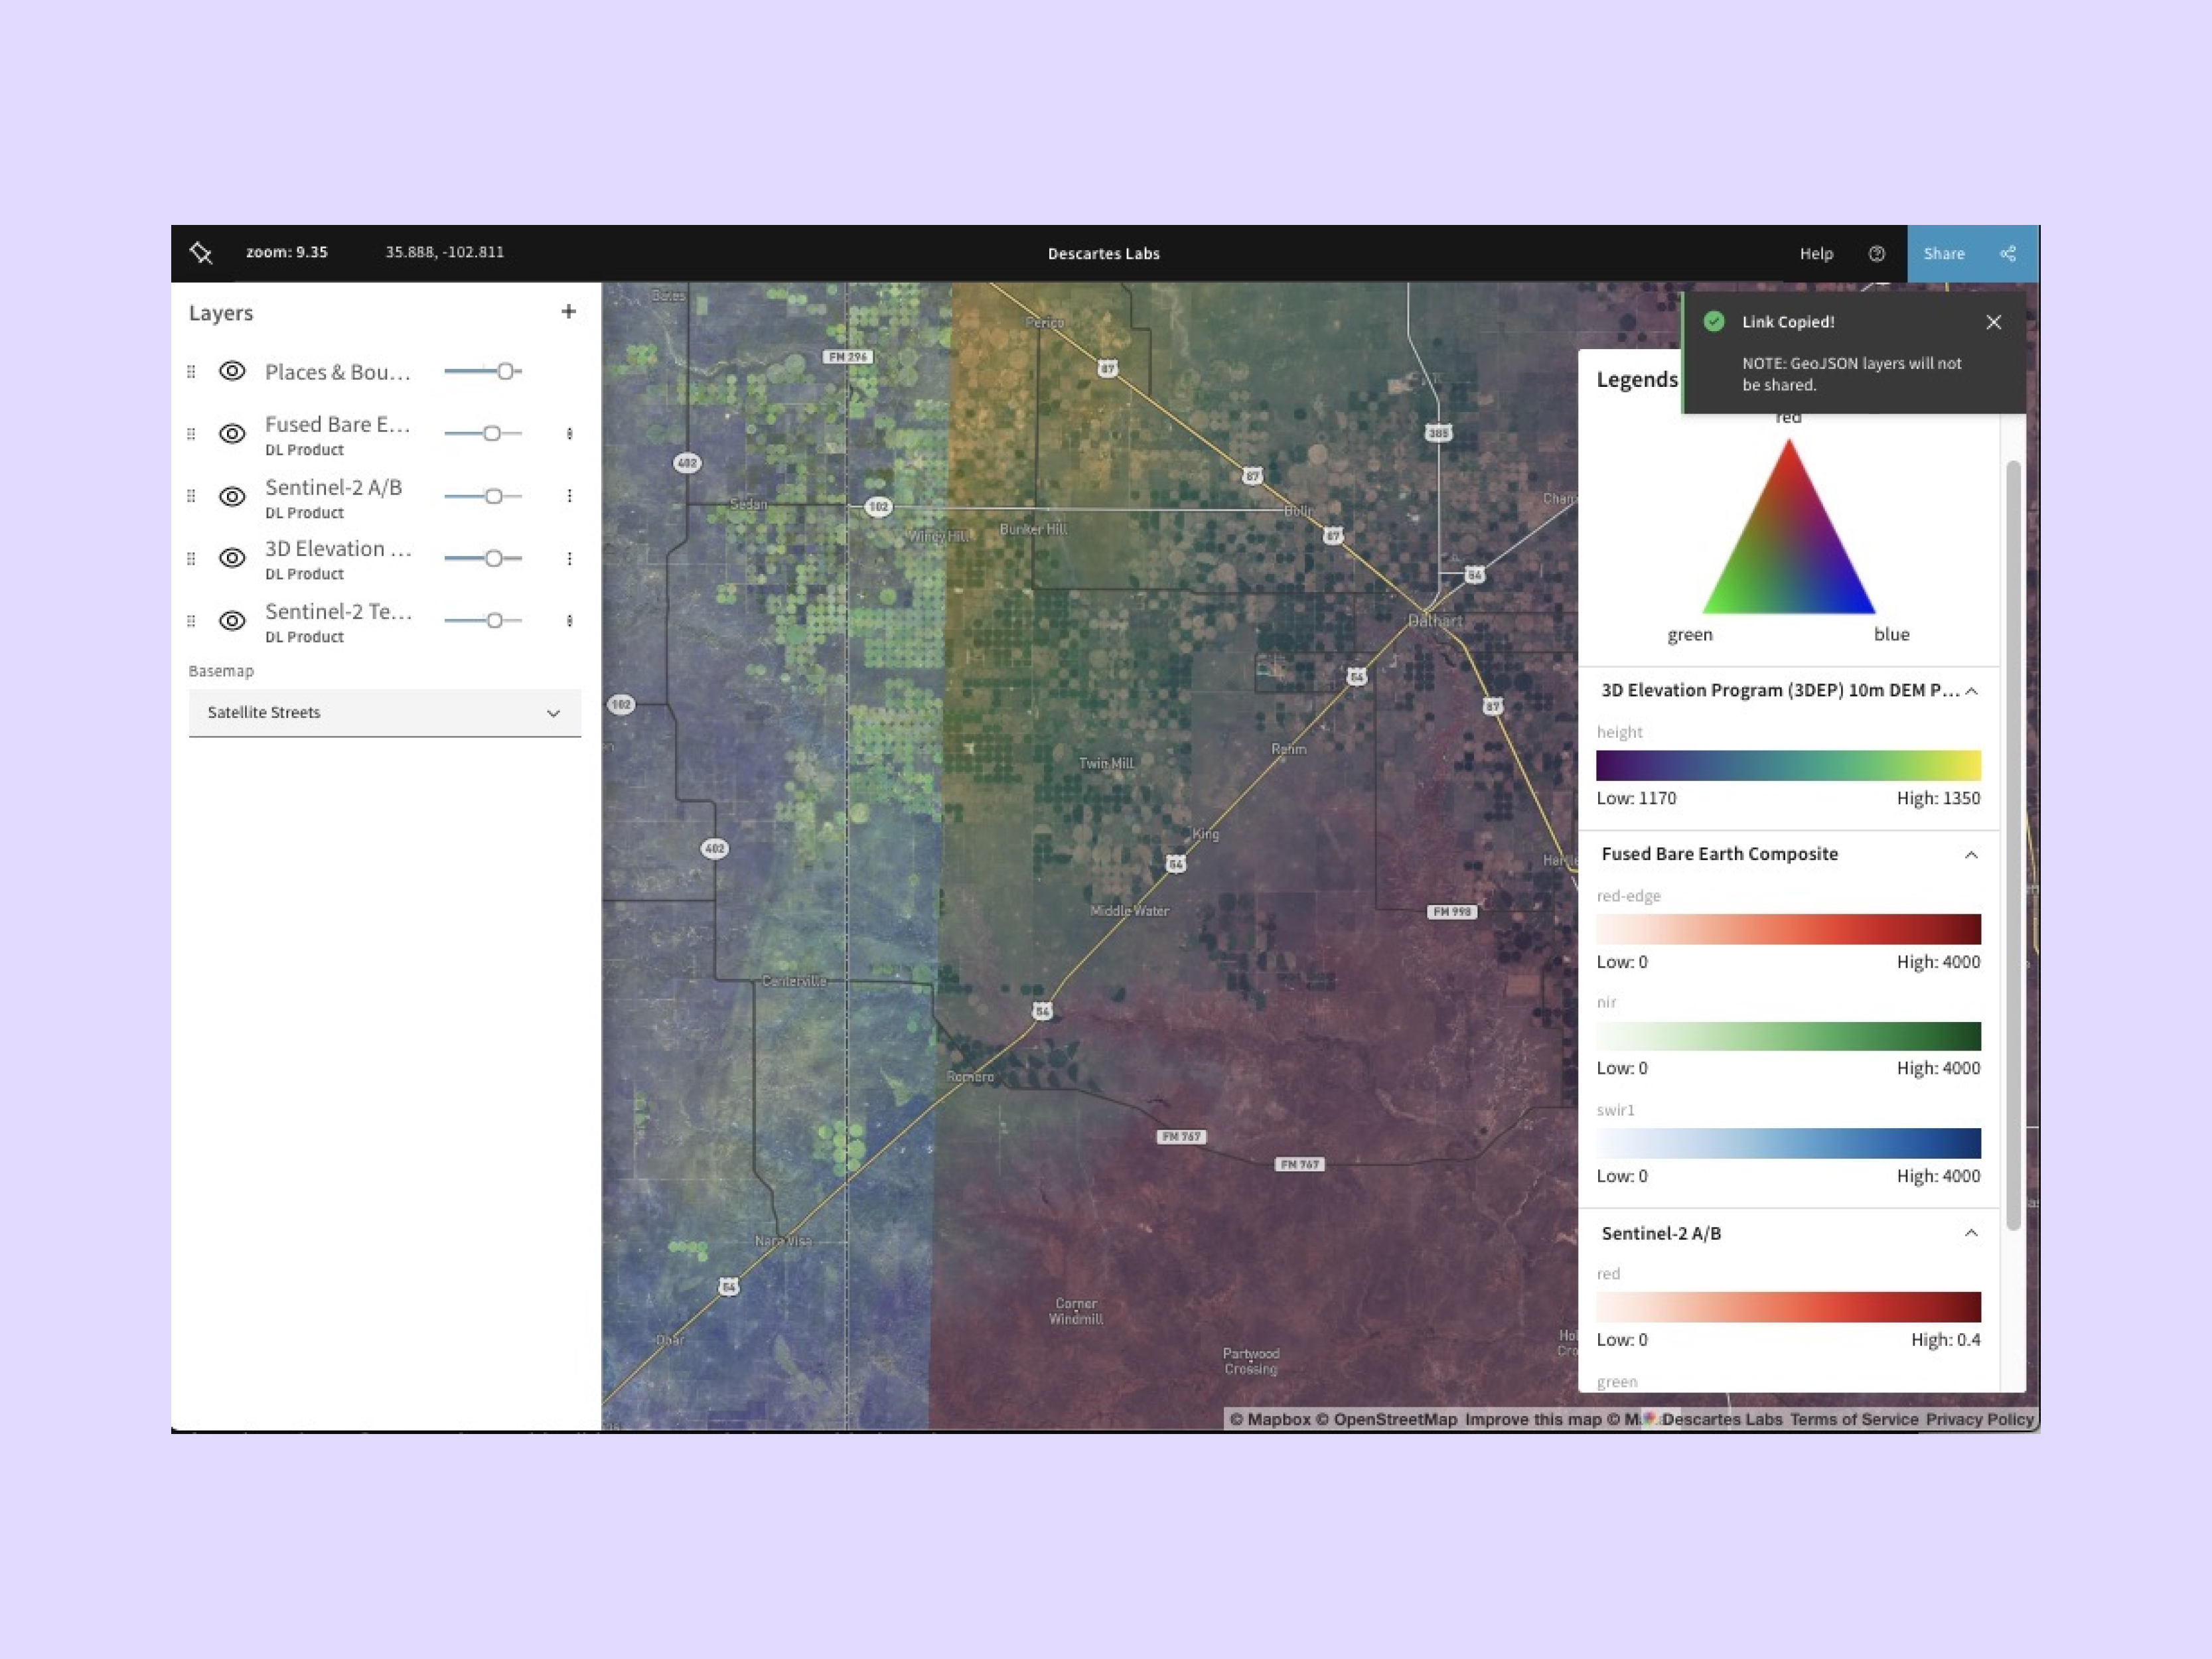
I designed and built a web-based viewer enabling scientists and customers to visualize processed imagery, compare temporal data, and interactively adjust visualization parameters without writing code. Unlike traditional desktop GIS software that runs locally, the browser-based approach made collaboration seamless: scientists could share maps via URL, making it easy for remote teams and customers to view results without software installation.
My Role #
I was both UX designer and frontend engineer on this project, working with 1-2 other frontend engineers and applied scientists.
As designer: Conducted user research with scientists, created wireframes in Balsamiq, mockups in Figma, and iterated based on feedback
As engineer: Built the React/TypeScript application, built Redux state management, integrated Mapbox GL
Technical Challenge: State Management #
The biggest challenge was keeping Mapbox GL's internal state synchronized with React. Maps are stateful (viewport, zoom, layers) and Mapbox GL manages this internally, separate from React's component state.
Solution: Redux as single source of truth. All state changes went through Redux first, then we imperatively updated Mapbox GL. This prevented conflicts and enabled features like map state serialization for sharing.
Key Features #
Multi-source data loading: GeoJSON upload, custom URLs, or search Descartes Labs data catalog
Layer management: Toggle visibility, adjust opacity, reorder layers. Editing and exporting layers used a slide-out panel to keep the map visible during configuration.
Map saving and sharing: Save map configurations and share them via URL, enabling collaboration and easy demo reproduction
RGB band stretching/Contrast enhancement: Scientists could adjust visualization parameters directly in the UI. This made an API call to reprocess imagery, but enabled real-time exploration without returning to code.
Ternary plot legends: Triangular diagrams showing how RGB bands are combined in composite imagery, helping users understand multi-band visualizations
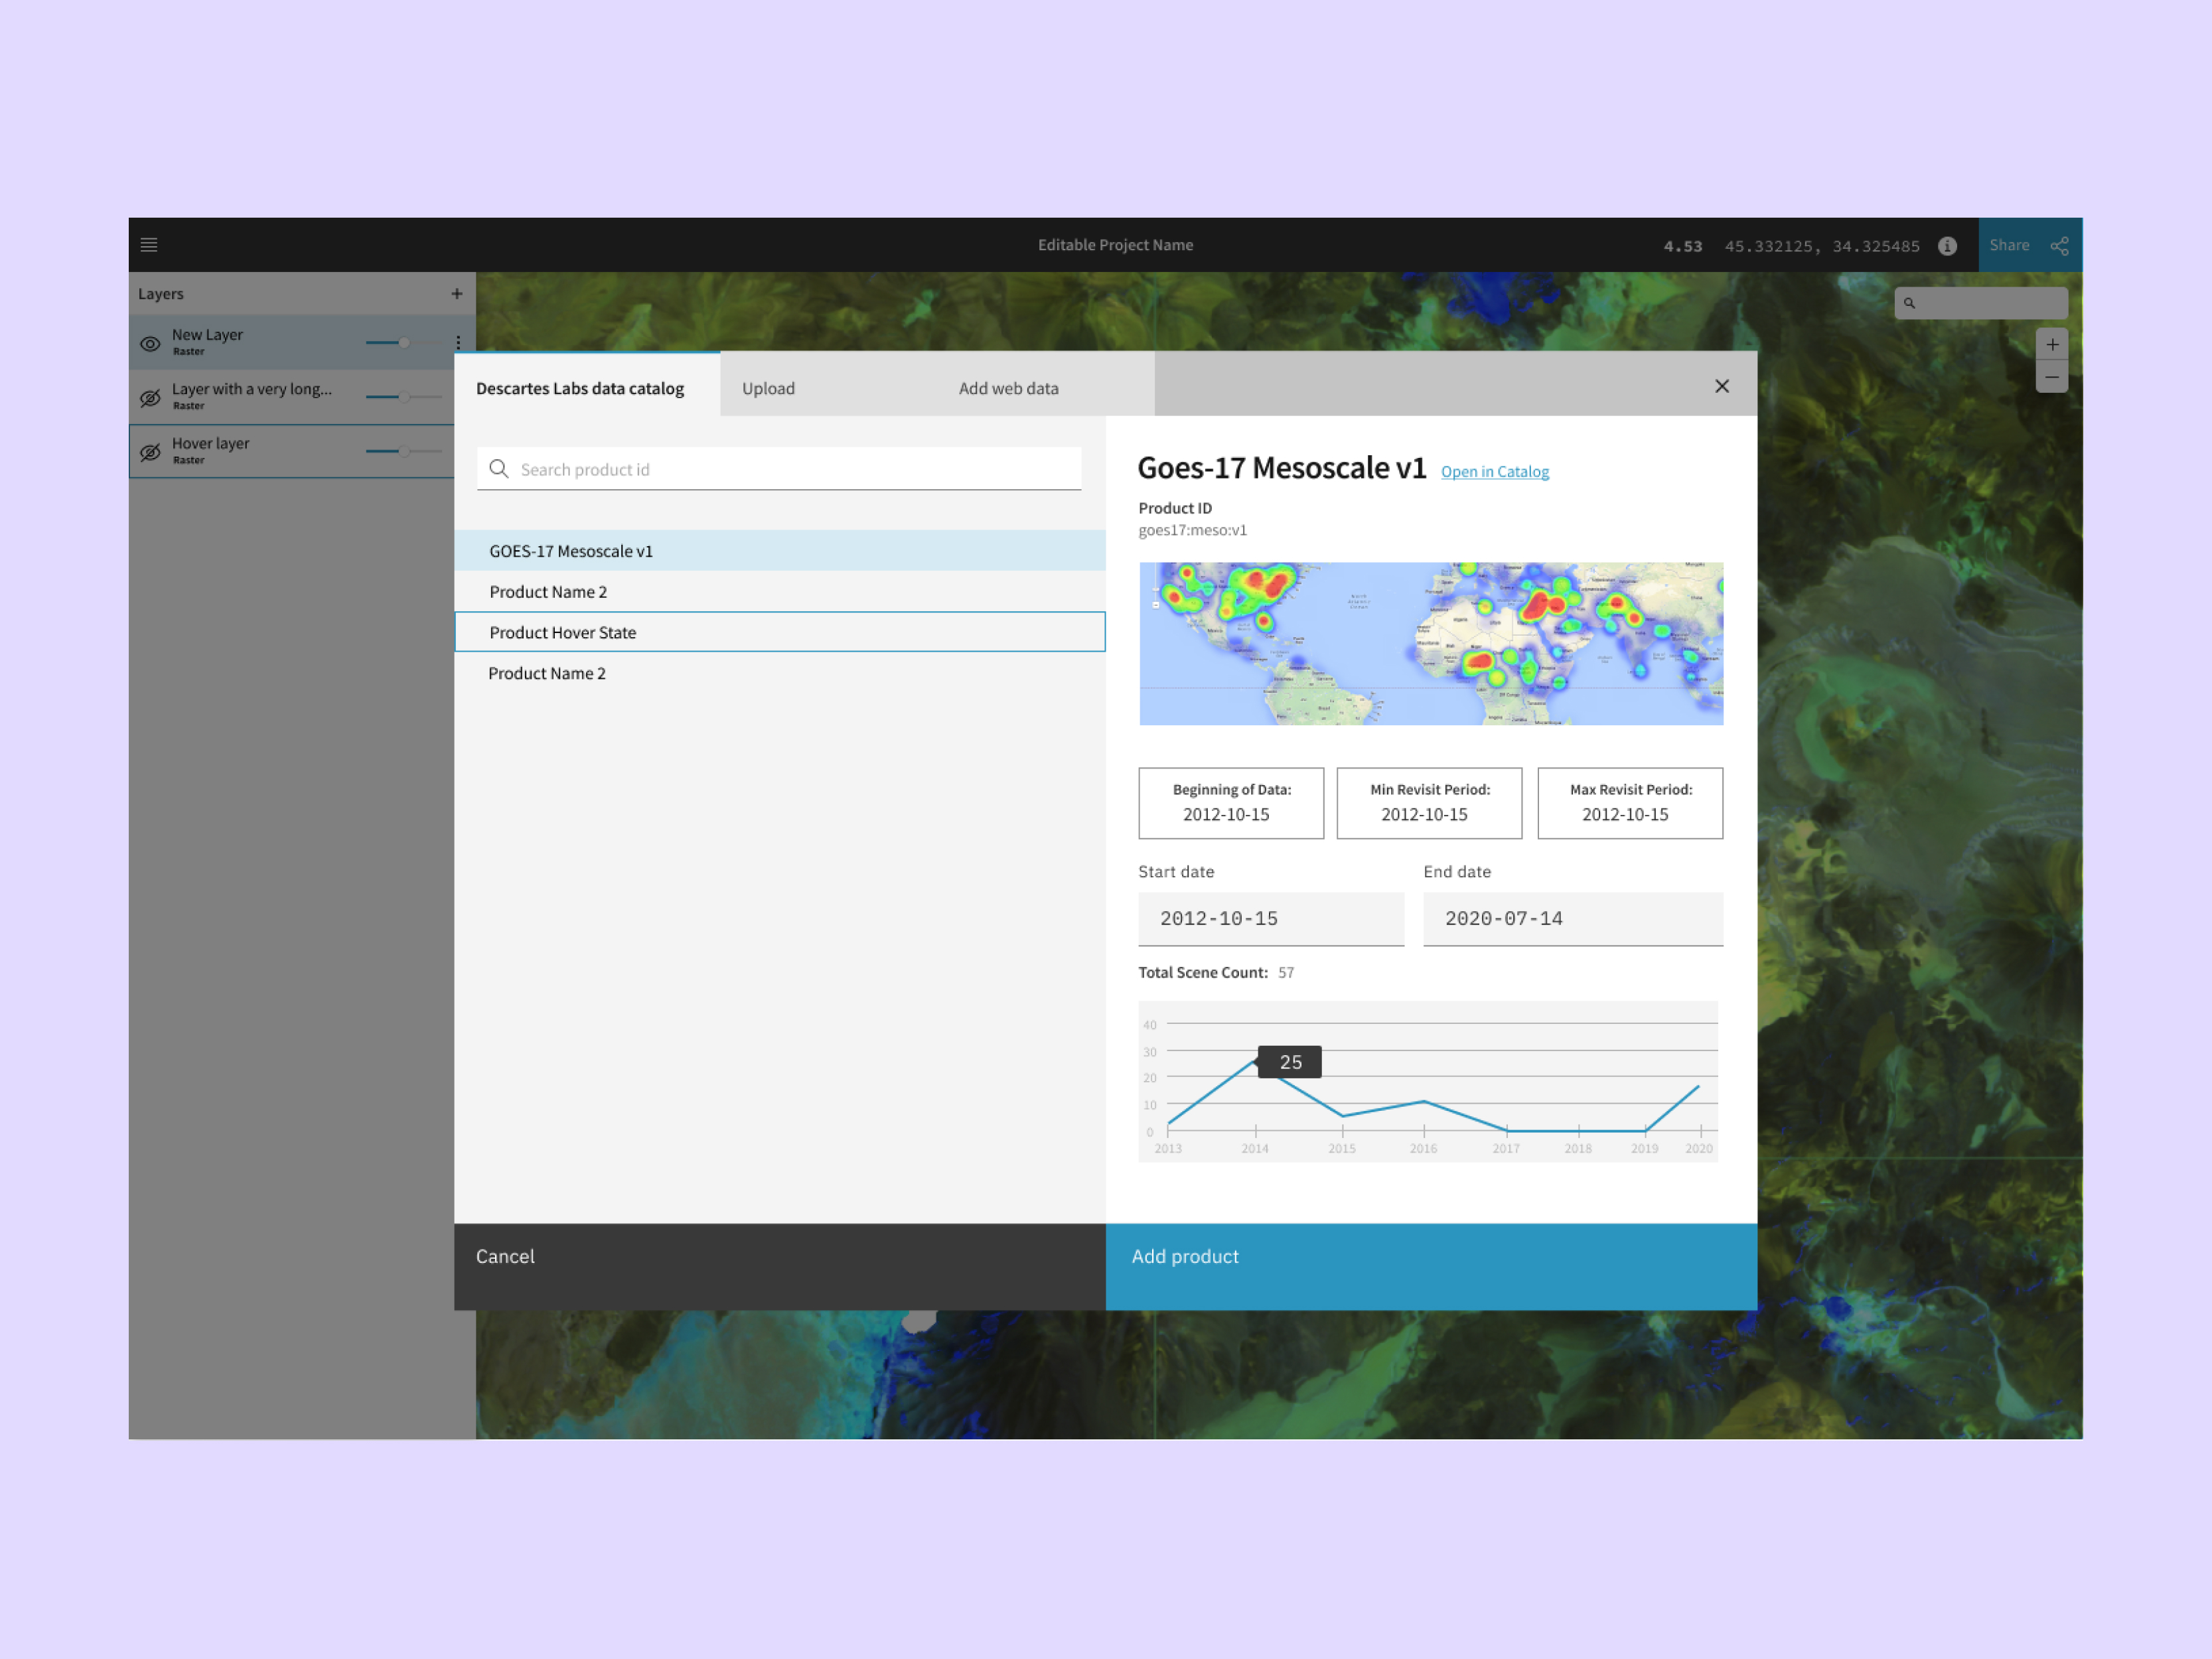
UI for searching the data catalog and adding a layer
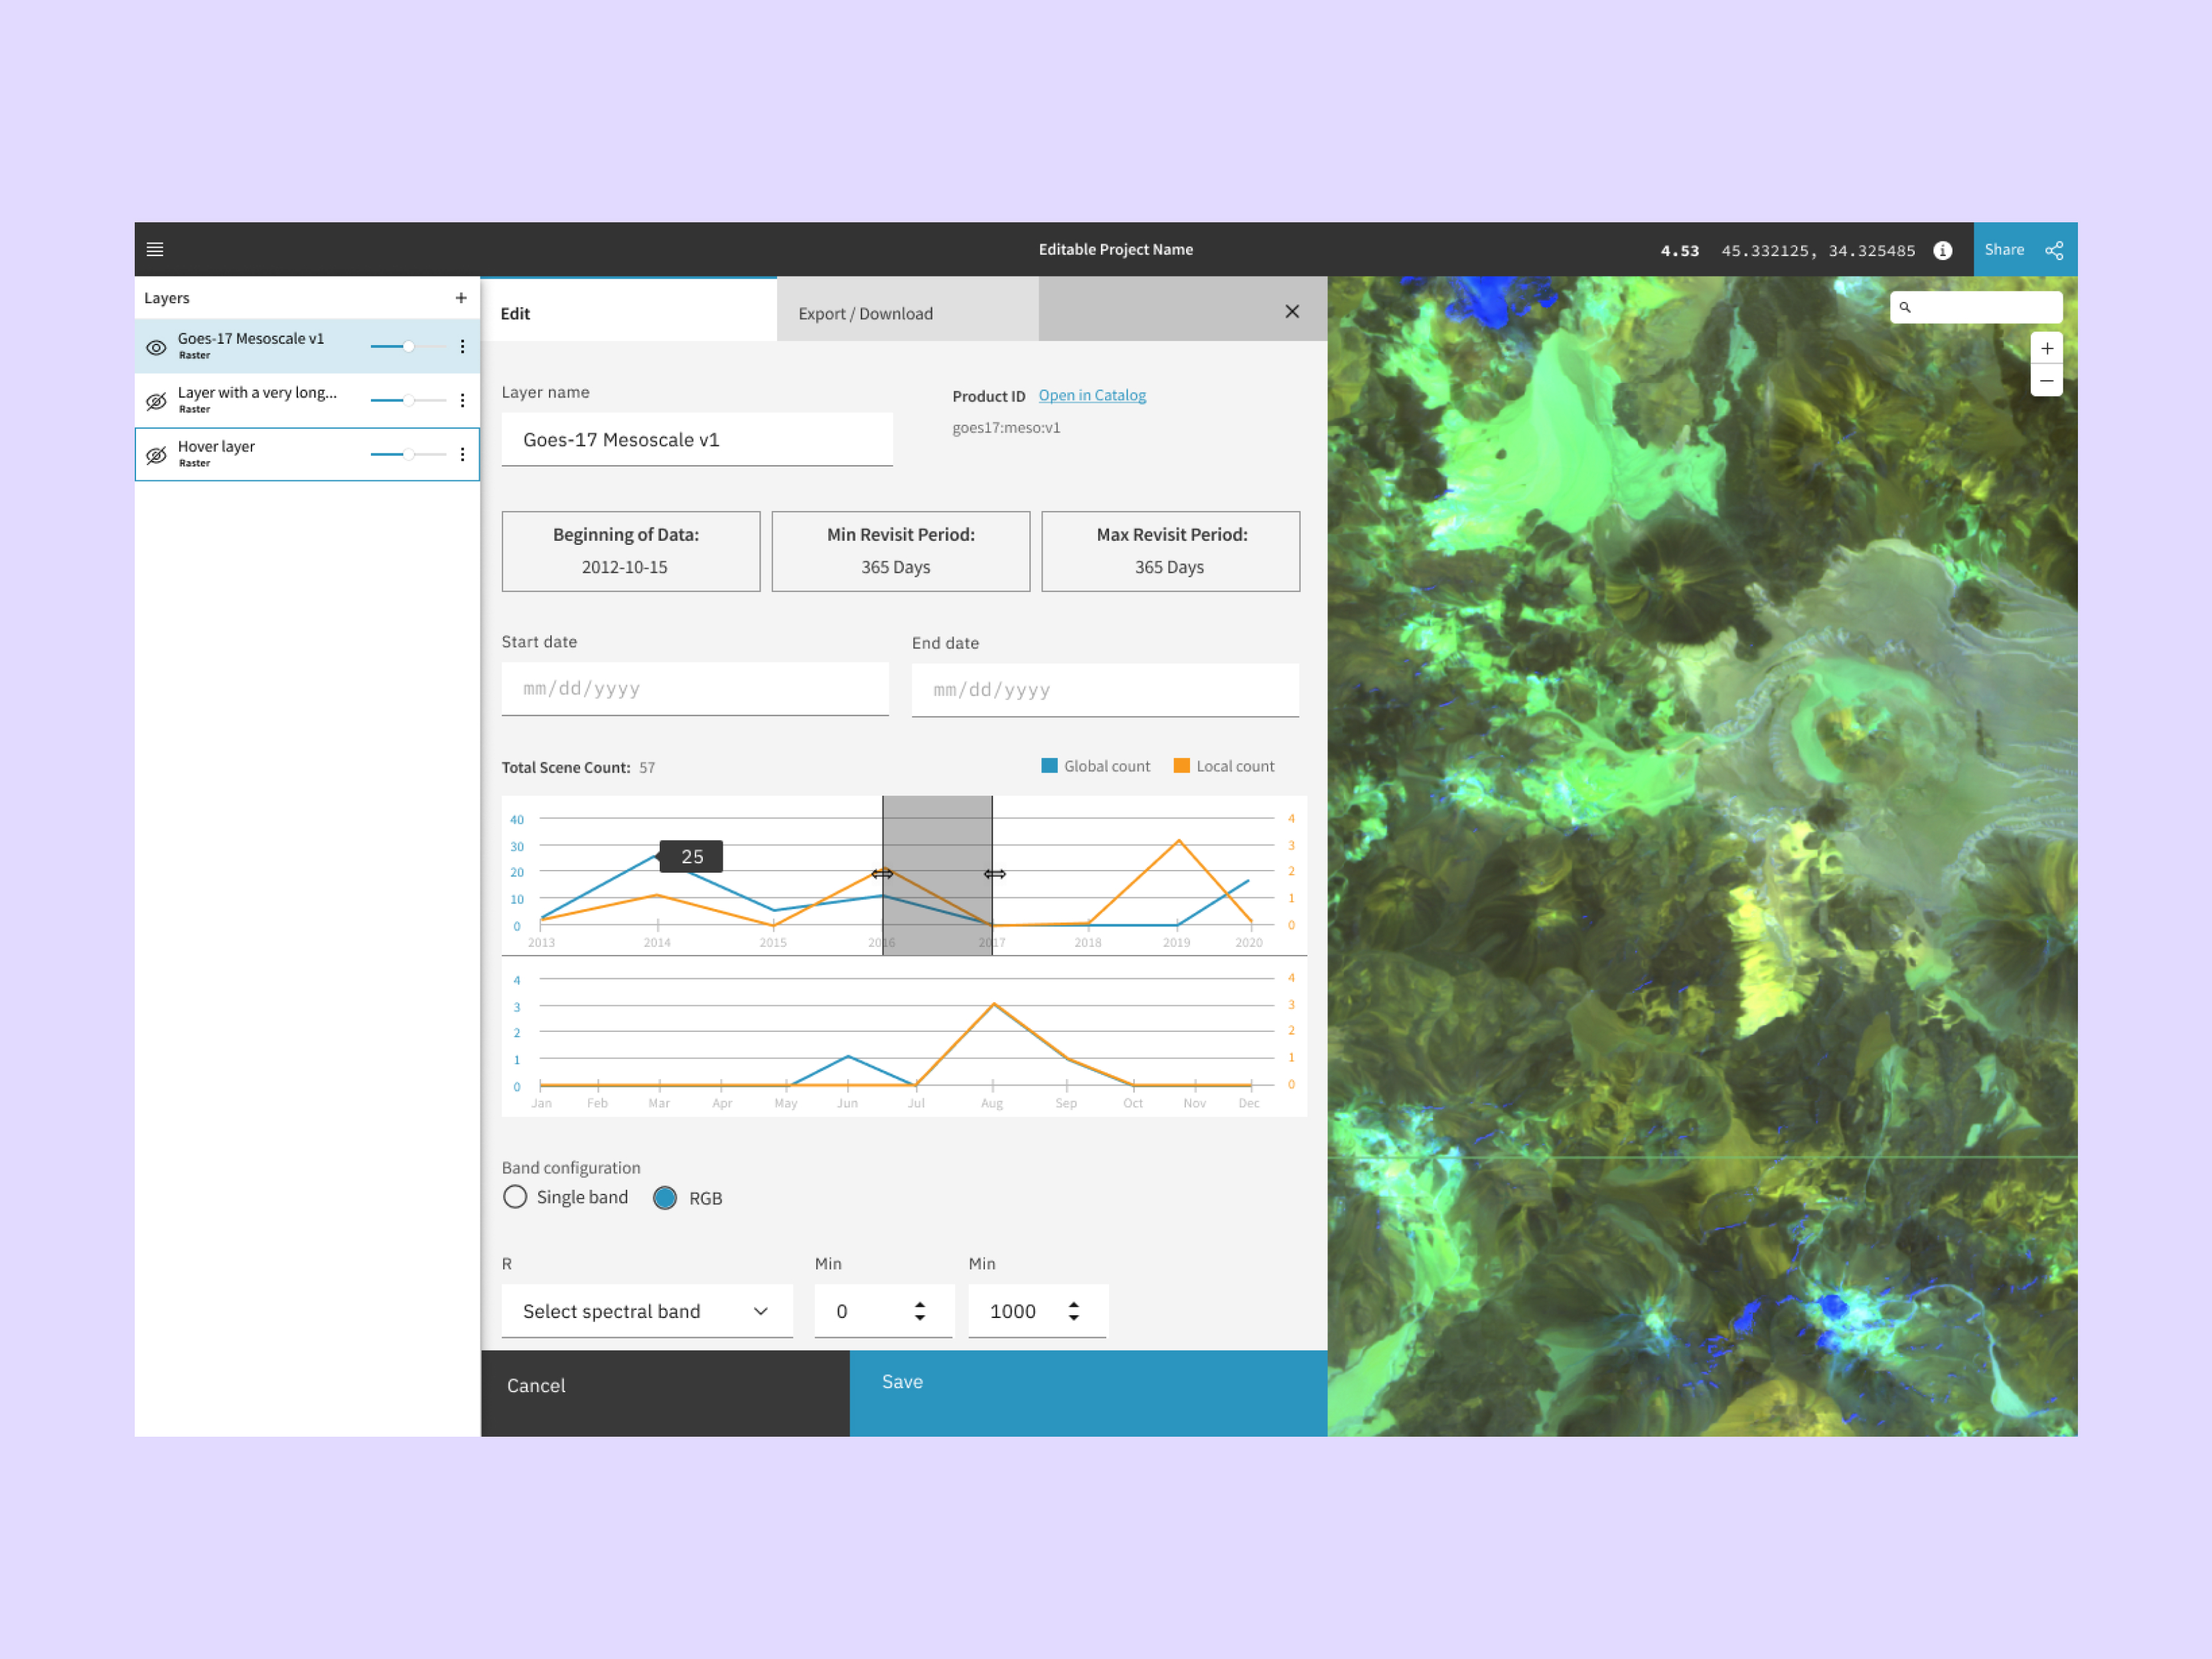
UI for editing a data product layer
Ternary plot legend
Design Process #
Key insight from user research: I initially assumed scientists wanted a viewer for already-processed data. User research revealed they wanted to continue editing - tweaking visualization parameters directly in the browser without returning to code. This shifted the design from a simple viewer to an interactive editing tool.
This insight drove feature priorities: adding RGB band stretching controls, ternary plot legends for understanding composites, and slide-out panels for layer editing that kept the map visible during configuration.
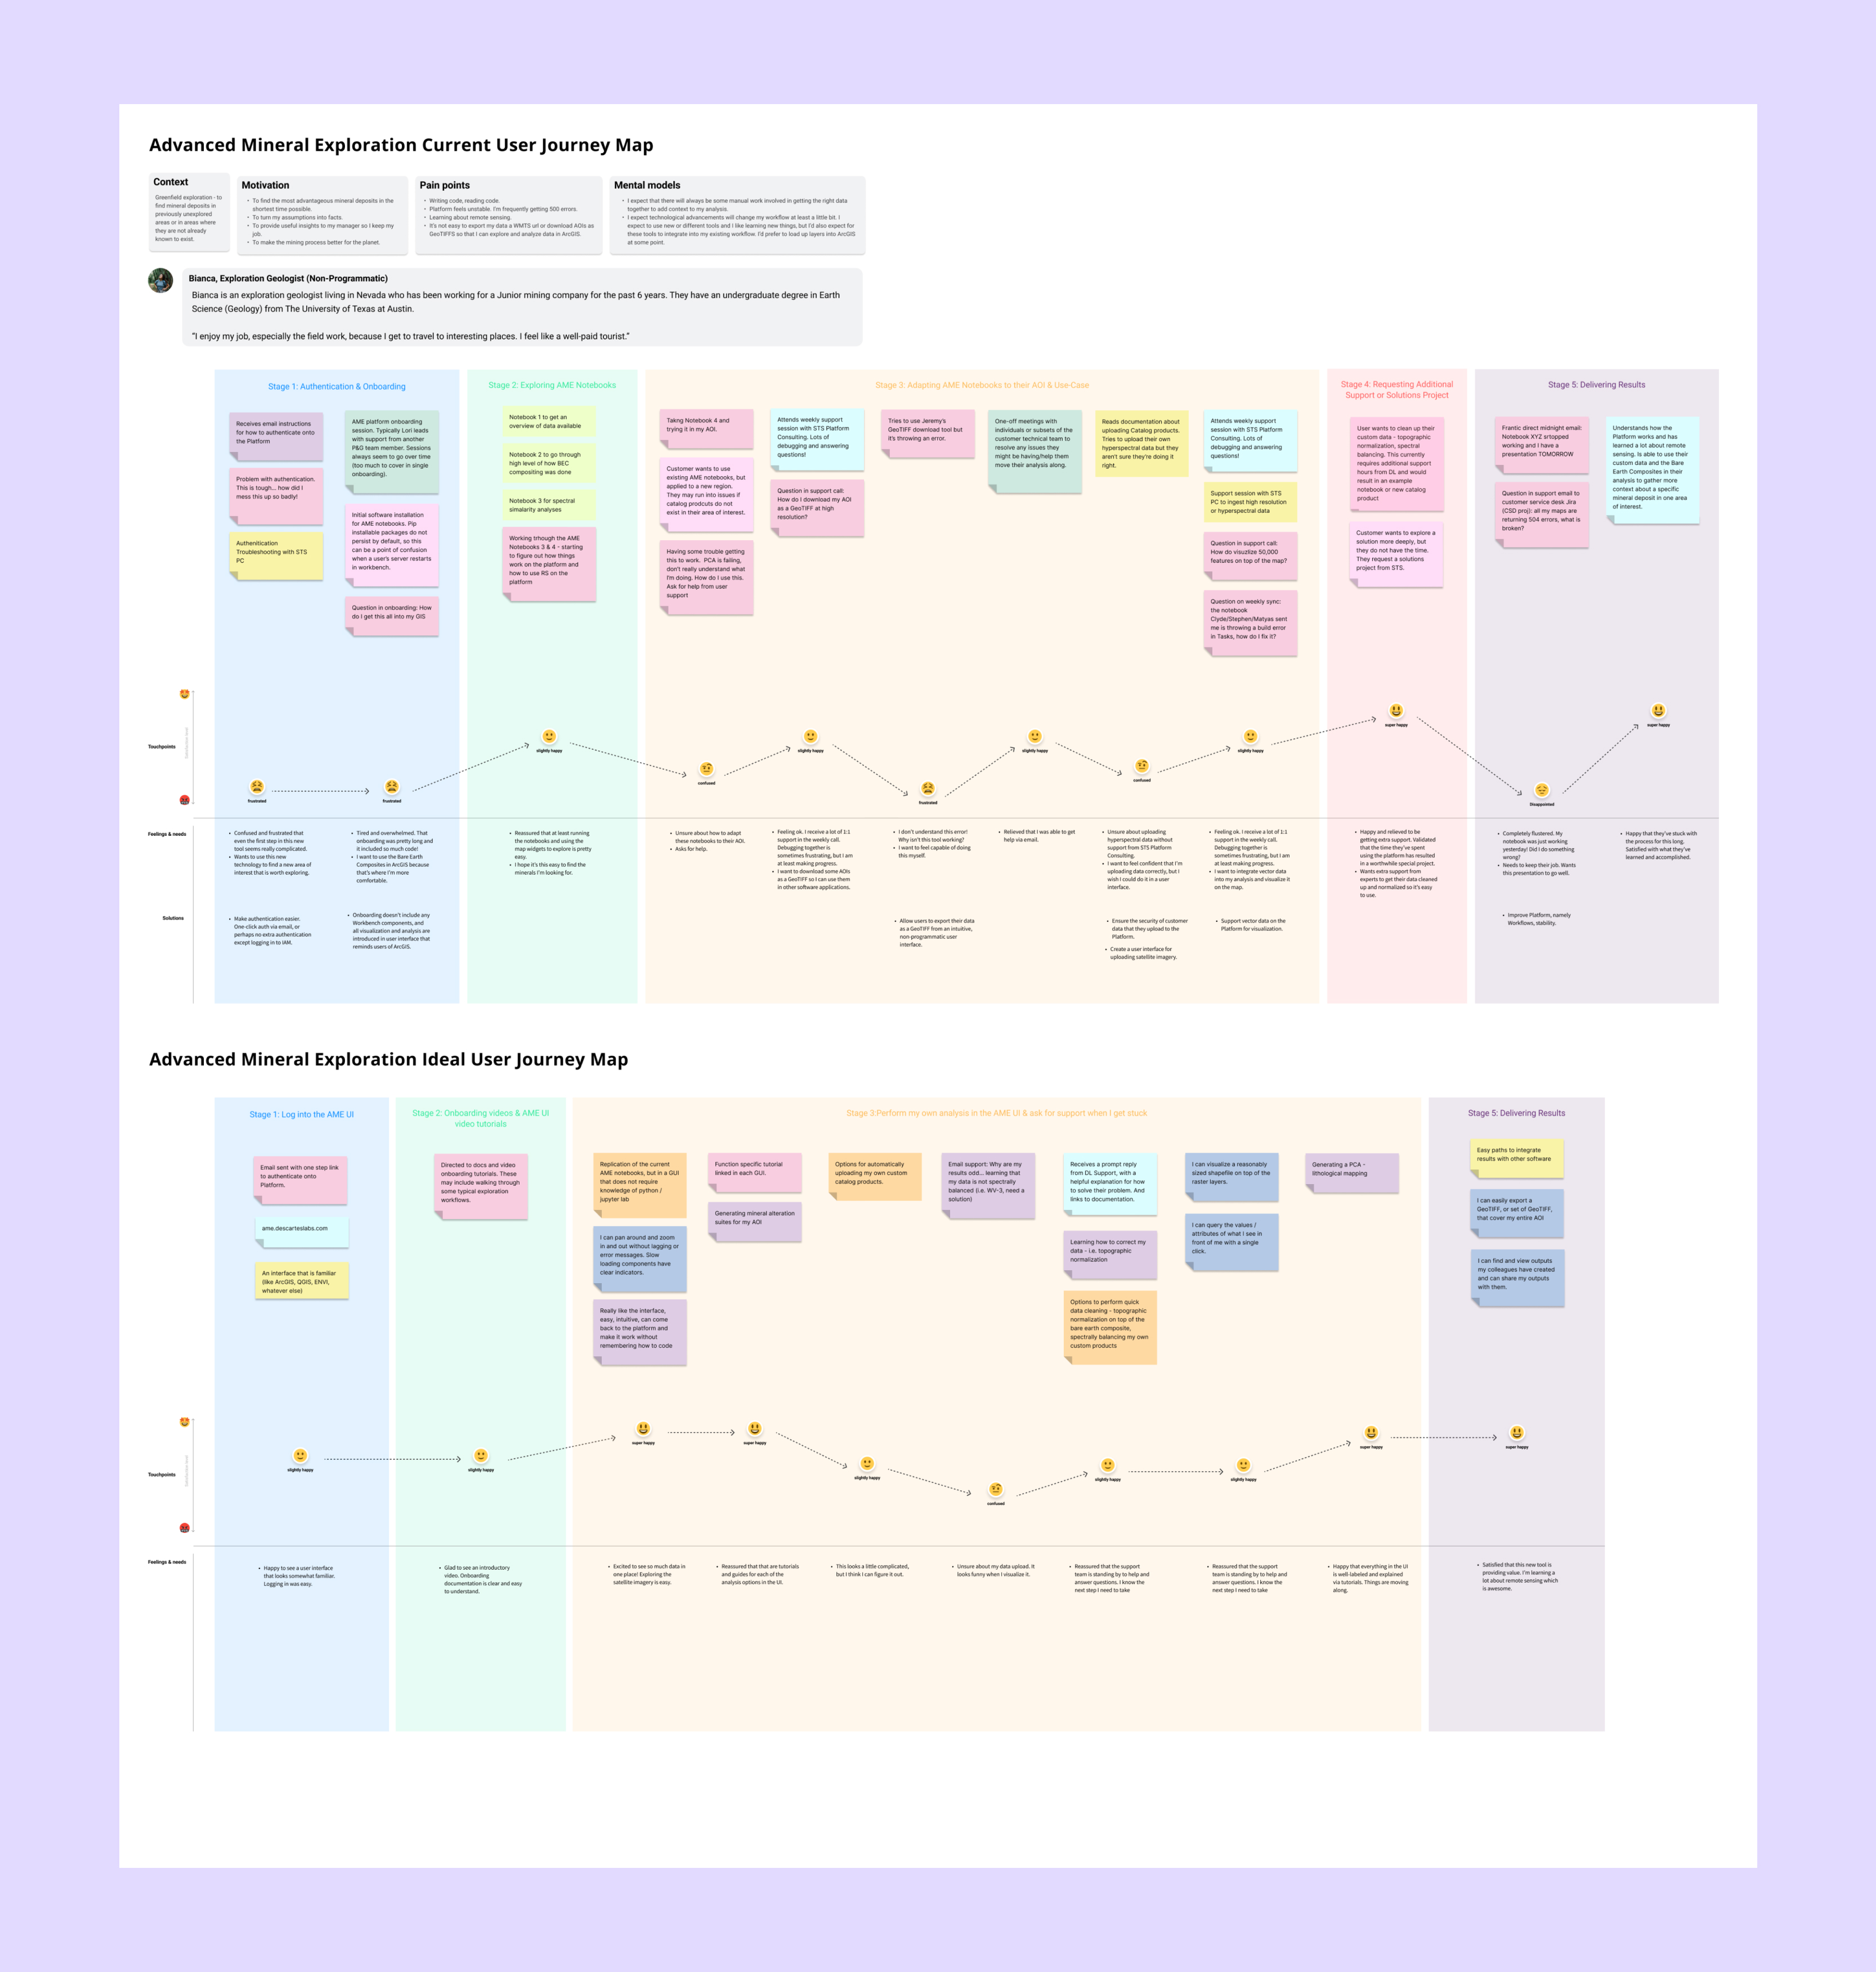
User journey map for advanced mineral exploration
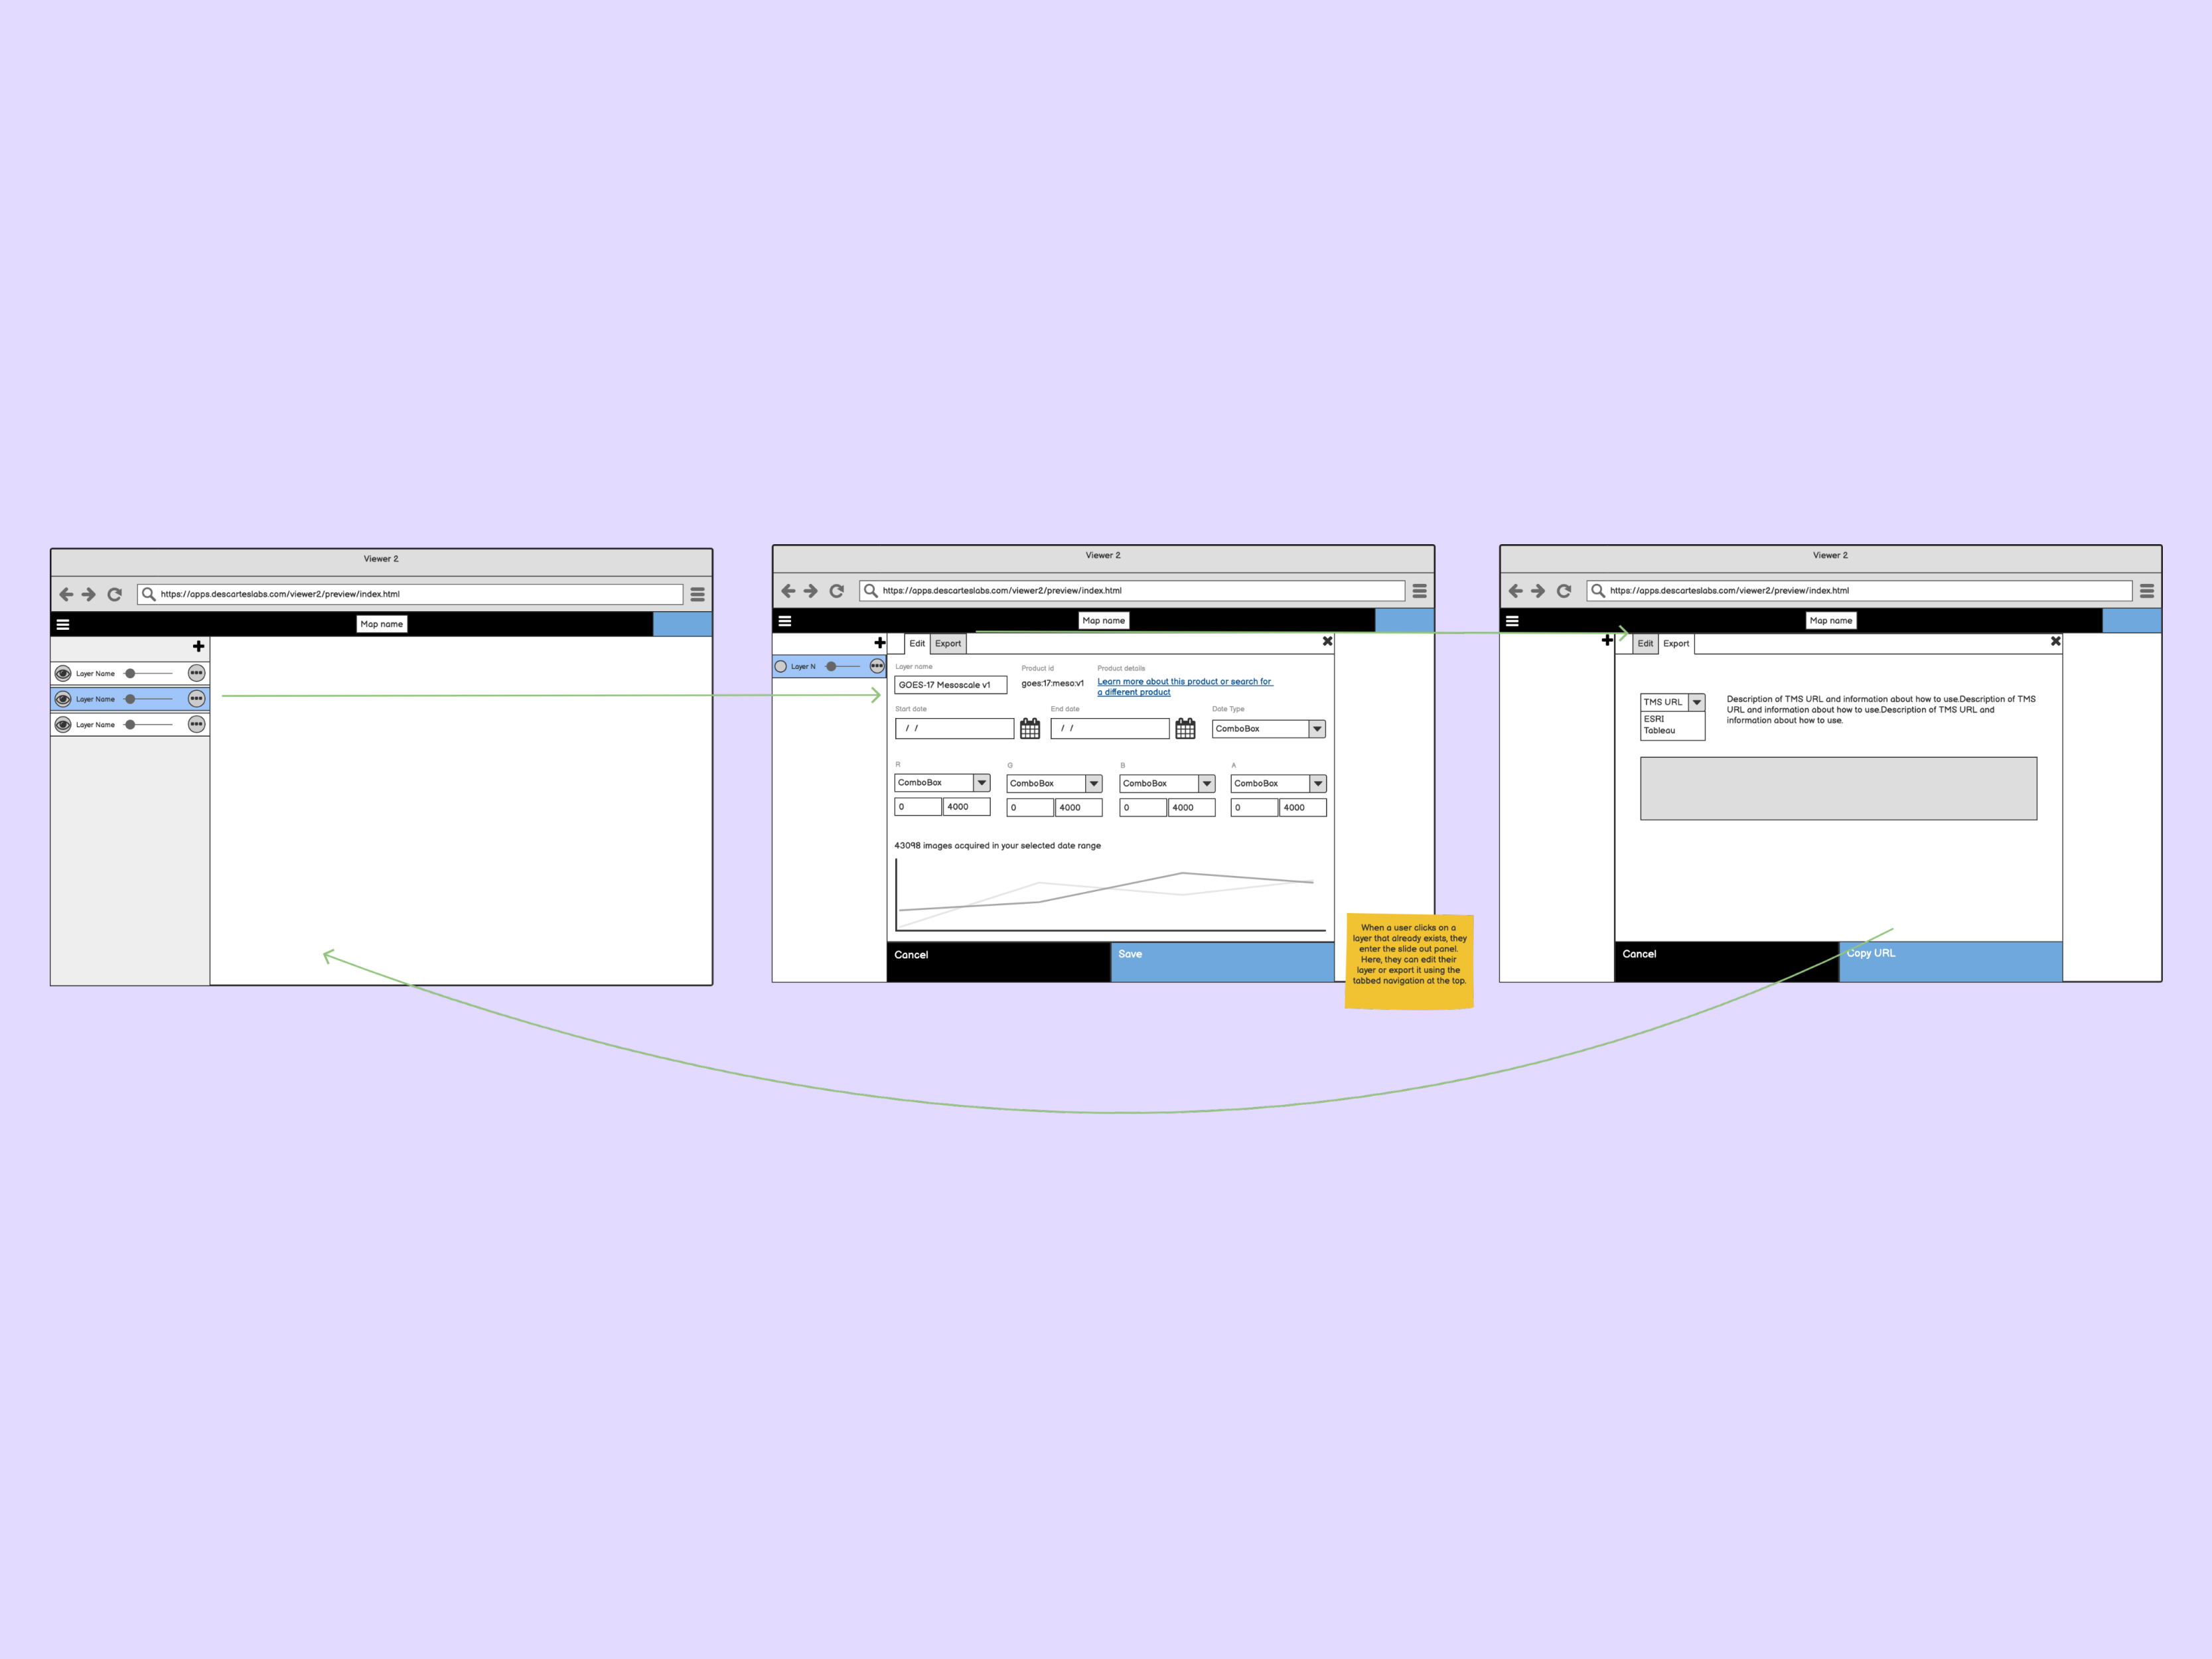
Export layer flow wireframe
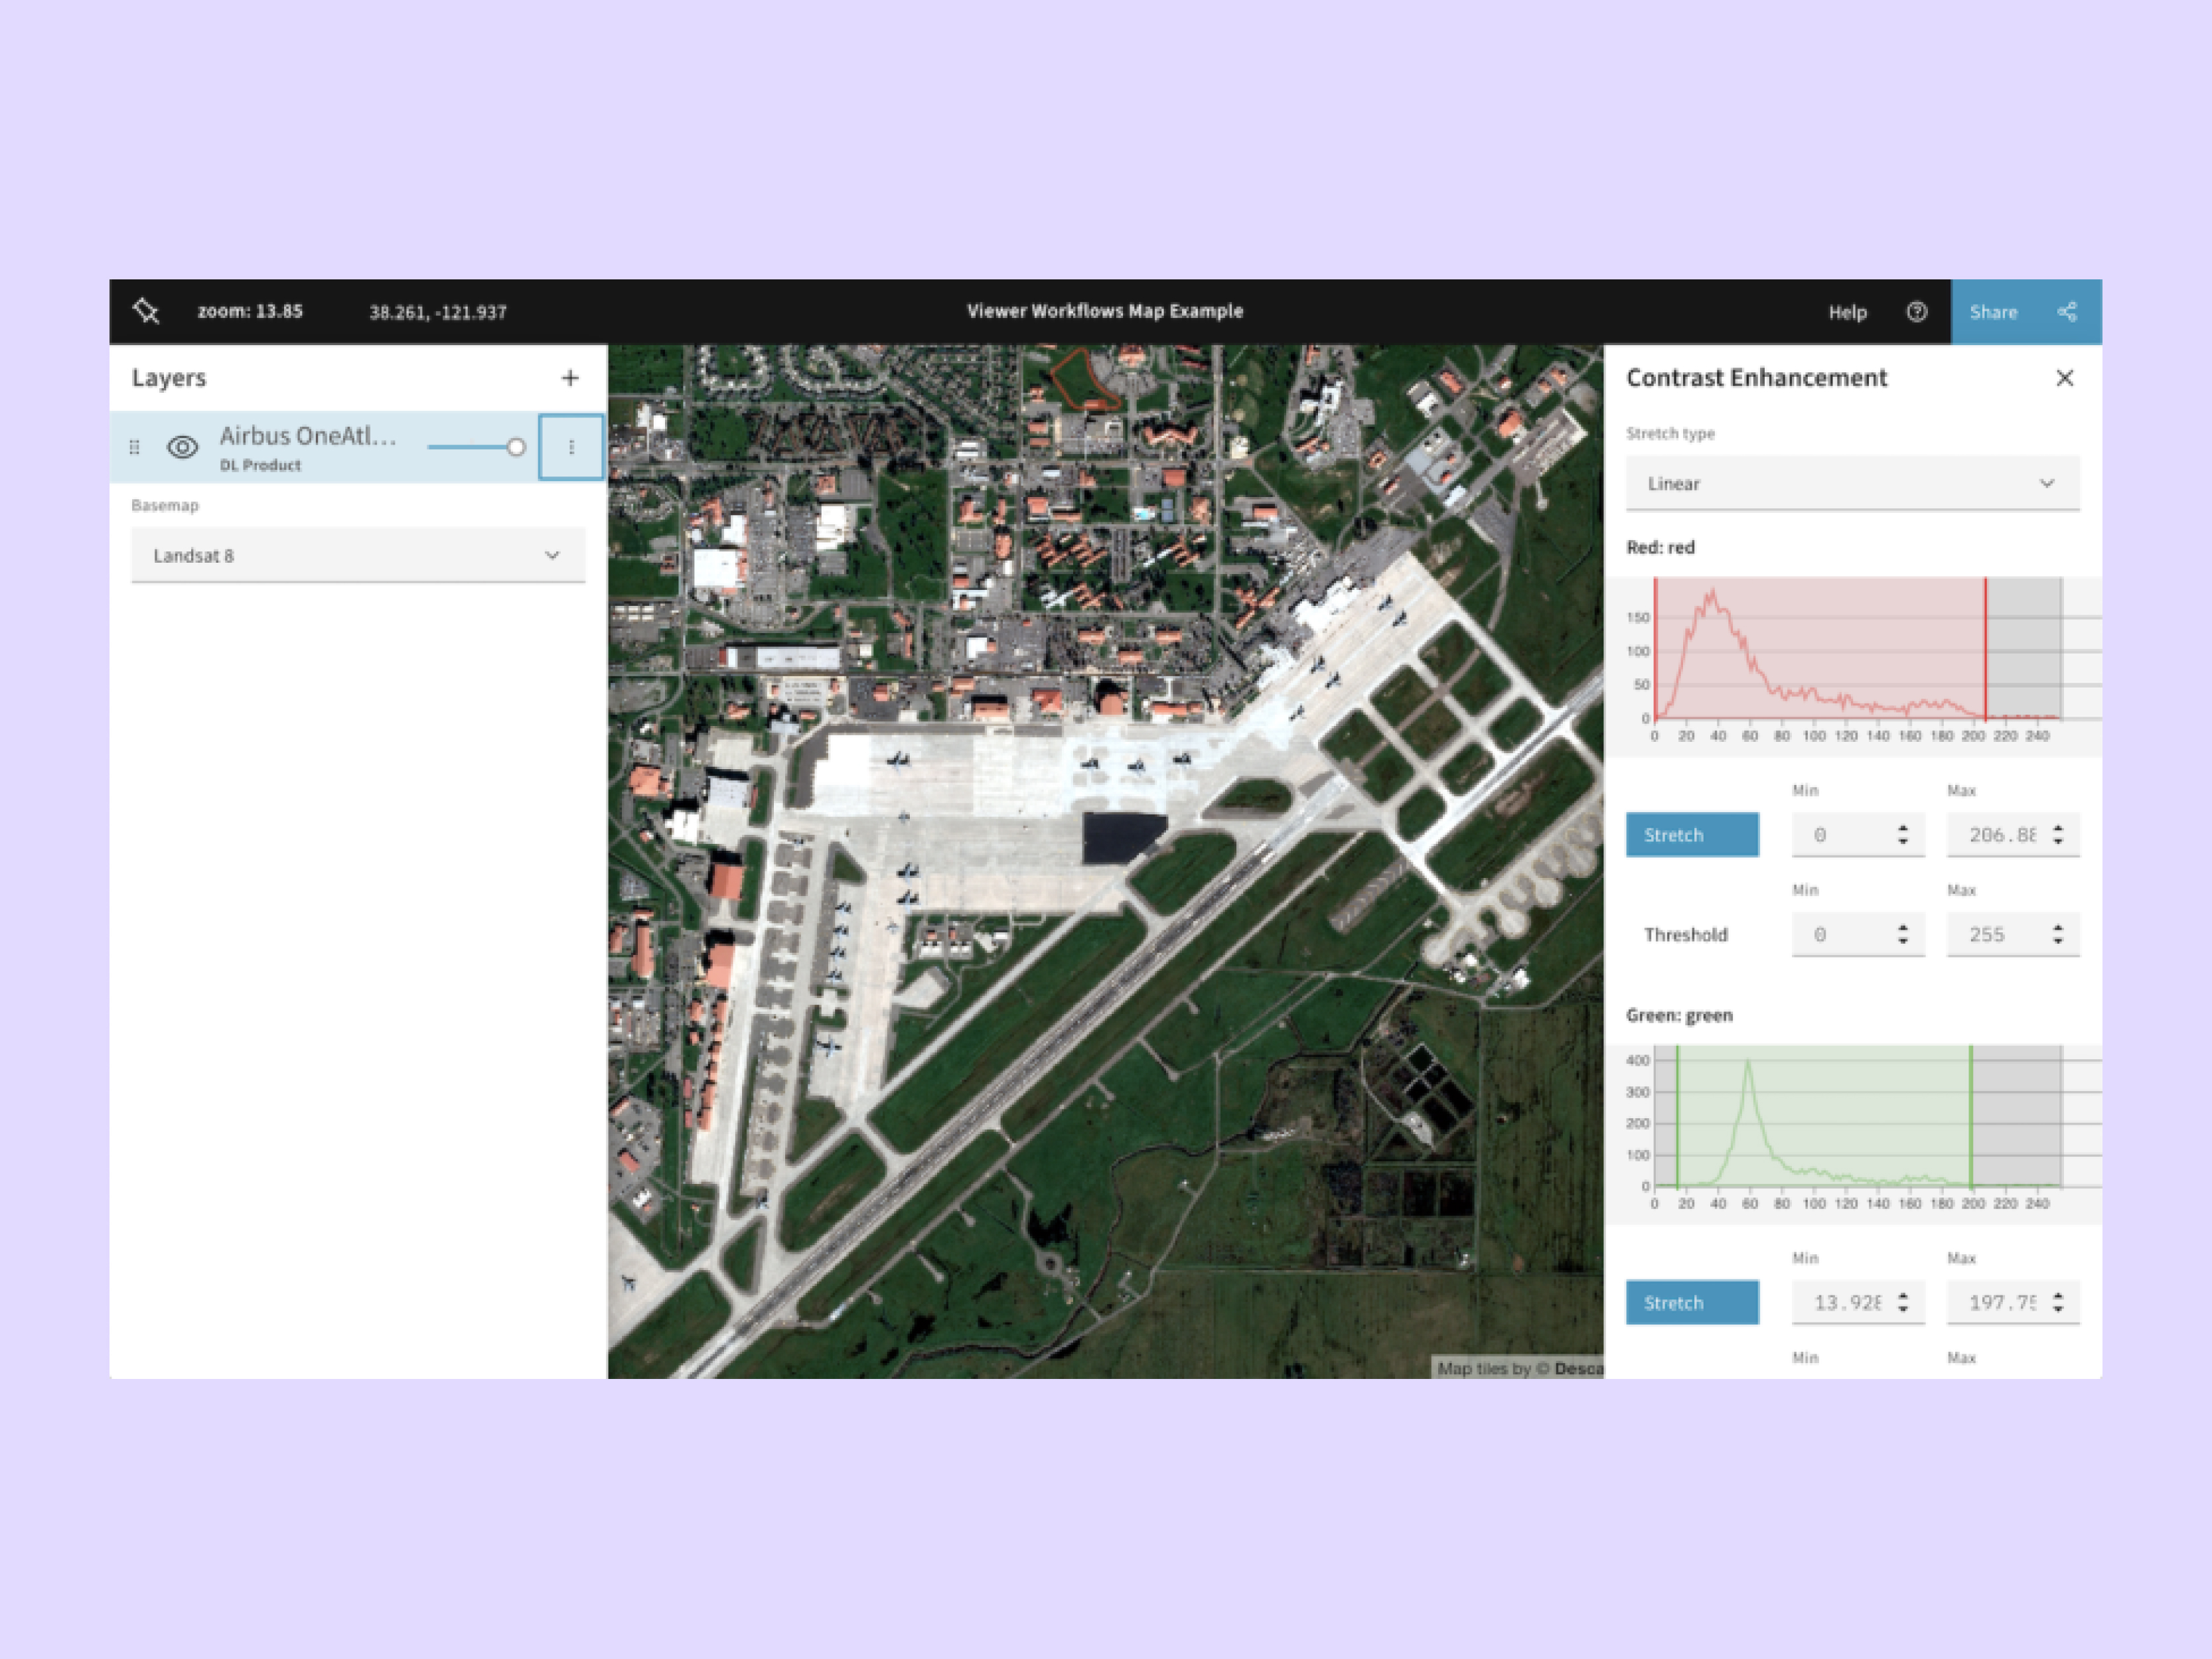
Final interface with RGB band stretching/contrast enhancement
Key Takeaways #
State architecture: Making Redux the single source of truth eliminated synchronization bugs and enabled map sharing
User research: Technical users think in data layers and transformations; they wanted tools that kept the map visible and allowed fluid transitions between viewing and editing
Design assumptions: The line between "viewer" and "editor" isn't clear. Instead, users wanted to fluidly move between viewing and tweaking data
Sales impact: The only non-API product became critical for demos, making the platform's capabilities tangible to non-technical decision-makers
Impact #
Became Descartes Labs' primary sales demo tool - the only product accessible to non-technical decision-makers. Enabled interactive demonstrations of platform capabilities during sales calls, helping close deals by making complex satellite imagery processing tangible and visual.
Tech Stack #
React, TypeScript, Redux, Mapbox GL JS